
By Andrew Inman, P.Eng., CRL, CMRP
Previously, we discussed how now is the best time to improve and that a Maintenance Management Plan provides a foundation aligned with your objectives. As a maintenance manager, operations director or asset owner you know that ineffective metrics risk escalating inefficiencies, unplanned downtime, more reactive maintenance, higher costs, and poor morale. But without a clear dashboard, you might be moving without knowing if you’re making progress.
How can you tell if your metrics are effective or if your plan is working? This is where metrics and Key Performance Indicators (KPIs) come into play.
This blog will explore how to build a metrics strategy that goes beyond charts. It’s about using data to drive decisions, align your team, and save time and money while minimizing risk. Think of your metrics system as a habit system: small, consistent behaviours that compound into outcomes far more effective than “once‑a‑quarter” heroics.
According to the Society for Maintenance & Reliability Professionals (SMRP), metrics are quantitative, measurable values used to track specific business processes. They are operational. Metrics show where your organization has been, where it is going, and whether processes are working correctly.
The SMRP defines a “Key Performance Indicator” (KPI) as an important, high-level, strategic indicator that highlights what matters most. They usually track results over a longer time frame than metrics.
Find Your “Why”: Aligning Metrics to Objectives
The most common mistake is trying to measure everything. Dashboards filled with unused data abound. I have sat through the dreaded “metrics review meeting” and stared at endless bar graphs. To avoid this, your team should step back and review how to identify and manage metrics and KPIs.
Your metrics shouldn’t exist in a vacuum; they must connect to those who care about them and your goals. Imagine a maintenance technician calibrating an instrument. This task, though small, directly contributes to meeting regulatory requirements, improving operational efficiency, and reducing costs. Creating a clear connection let’s everyone see their contribution to the organization’s success including:
- Mission, Vision, and Values: What is the organization trying to achieve? What is your group trying to achieve?
- Strategies: How do our people and processes support our strategies?
- Tactics: What are our key tactics to deliver on the strategies? What does the team need to do to make those tactics successful?
The figure below is a sample output from an exercise that translates an organization’s vision into maintenance and asset reliability tactics. Translating strategic vision into actionable tactics creates a clear link between high-level goals and daily operations.
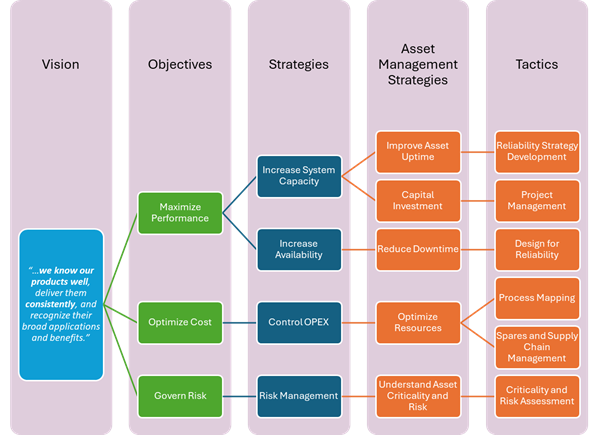
Sample Flow Alignment From Vision to Tactics
When you align what you measure from the shop floor to the boardroom, you build accountability and a sense of purpose. You move from wondering how you fit to understanding why it matters and why you should care.
Designing the Habits Behind Leading and Lagging Indicators
When choosing metrics, understand the difference between leading and lagging indicators.
A Lagging Indicator is like a rearview mirror. It tells you where you’ve been. In maintenance, these metrics include “Total Downtime” and “Budget Spent.” They focus on results at the end of a process. Well‑designed maintenance habits pull lagging results in the right direction.
A Leading Indicator tells you what lies ahead. It measures the processes and activities that shape results. Leading indicators like “Schedule Compliance” or “PM Completion” signal how results such as mean time between failures or percent overtime will trend. Leading indicators are where you can design the behavior your group is looking for so make those behaviors obvious, easy, attractive, and satisfying.
To tell if an indicator is leading or lagging, ask: “Does this metric reveal the process or just show results?” Some metrics may be both, depending on what they measure. Asking “Which decision would this metric influence?” clarifies its value and focus.
The figure below provides a sample structure of metrics for a simple work order process. These metrics help paint a clear picture of your maintenance effectiveness and which areas need improvement.
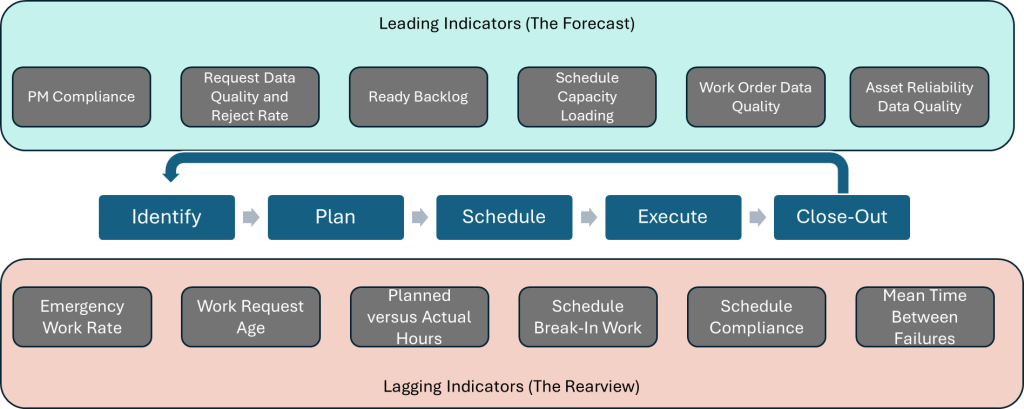
Sample Leading and Lagging Metrics for Work Order Processes
What “Good” Looks Like: Benchmarking Your Performance
Once you have your metrics, how do you know if you are succeeding? You need benchmarks. Industry “Best-In-Class” standards, such as SMRP’s, provide targets.
But setting targets isn’t just aiming for the best. Every facility is unique. Overly high targets may frustrate teams or seem out of reach. During annual goal-setting, work with leaders to use a tiered model, such as “base, target, wow.” This keeps momentum on progressive goals while aiming for excellence. A sense of accomplishment is key to ensuring teams feel supported in achieving these objectives. Two important aspects of benchmarking are:
- Reviewing progress on these targets: As a team, discuss what’s working, what’s not, and areas for improvement. Build a “no-blame” environment where you win together and support each other.
- Turning metrics into action: Nothing is more frustrating than discussing metrics with no follow-up.
Turning Data into Action
Data collection requires quality and consistency. But the key question to ask is: “What decisions are we making with these metrics?”
If a metric doesn’t help you allocate resources, monitor processes, track asset uptime, or find training gaps, it’s likely just noise. A concise, relevant set of insights drives action and leads to improvement. Effective monitoring highlights wins and gaps and builds team ownership.
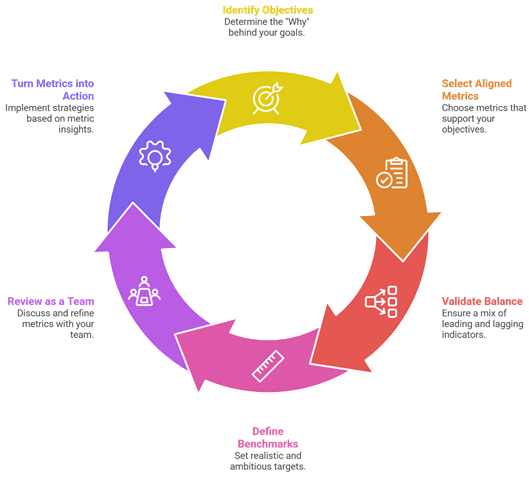
Metrics and KPI Development Process
Conclusion
By setting realistic yet ambitious targets, fostering open communication, and using data effectively, your team can move from simply maintaining assets to building a strong reliability culture. The key takeaways are:
- align metrics with objectives
- distinguish between leading and lagging indicators
- benchmark meaningfully, and
- ensure data leads to action.
Begin with a simple step: try a 15-minute ‘dashboard audit’ with your team. Review your current metrics with your team and turn your data into real results. If a metric can be rewritten in less than 2 minutes, do it now. If you cannot make insights from one metric in less than 60 seconds, simplify the metric. If a 15-minute audit is too much, start with one metric review during your regular team huddle. Remember to focus on metrics that drive decisions, set achievable benchmarks, and reinforce accountability.
Are you ready to set impactful benchmarks and transform performance? Contact me to customize your metrics and KPI strategy for lasting success.


